13 Steps on the Stairway to Heaven(ly) A/B Testing





Shane Curry
Shane Curry

Creating forms, calculators, and product configurators helps you generate more leads and boost conversions. You might be tempted to build these tools and send them into the digital wilderness without a second thought.
Doing so is likely a strategic mistake, though. Because performing A/B testing helps you get the most from these tools - think of optimal lead generation and conversion.
Common elements of A/B testing are:
Marketing and sales forms
Sales email subject lines
Call to action buttons
Content formatting
Ad placements
Put two versions of your ConvertCalculator tool head-to-head to see which gets the best results. Our 13 steps on the stairway to heavenly A/B testing outline the process.
A/B testing (or split testing) is a method used to compare two versions of something - like a product configurator, calculator, survey, form, or quiz—to see which one performs better.

In simple terms, you create two versions of whatever you're testing. Then, you randomly show one version to an audience segment and the other to a different segment. This lets you see which version gets better results.
The random aspect is vital so you don’t distort the outcome.
Say you’re creating a lead-generation quiz for your target audience on social media. You might want to test elements like:
Quiz length
Question variations
Content layout and formatting
A/B testing lets you know which quiz your audience likes best. Some parts of your audience randomly see your standard quiz (the control), while others see the changed quiz (the variation).
Increasing quiz submissions might be your main goal. Basically, the version that gets more submissions is the best performer.
Split testing like this helps you optimize the quiz - and any future ones - for your goals.
A/B testing helps you understand what changes are more effective for achieving your goals. These goals might be getting more clicks, sign-ups, or purchases.
Define your goals
Choose a metric to measure
Select a hypothesis
Determine sample size
Randomly assign users to groups
Create variations
Set up the test
Test for a predetermined duration
Monitor the results in real-time
Analyze the data
Draw conclusions
Implement the winning variation
Repeat and test again
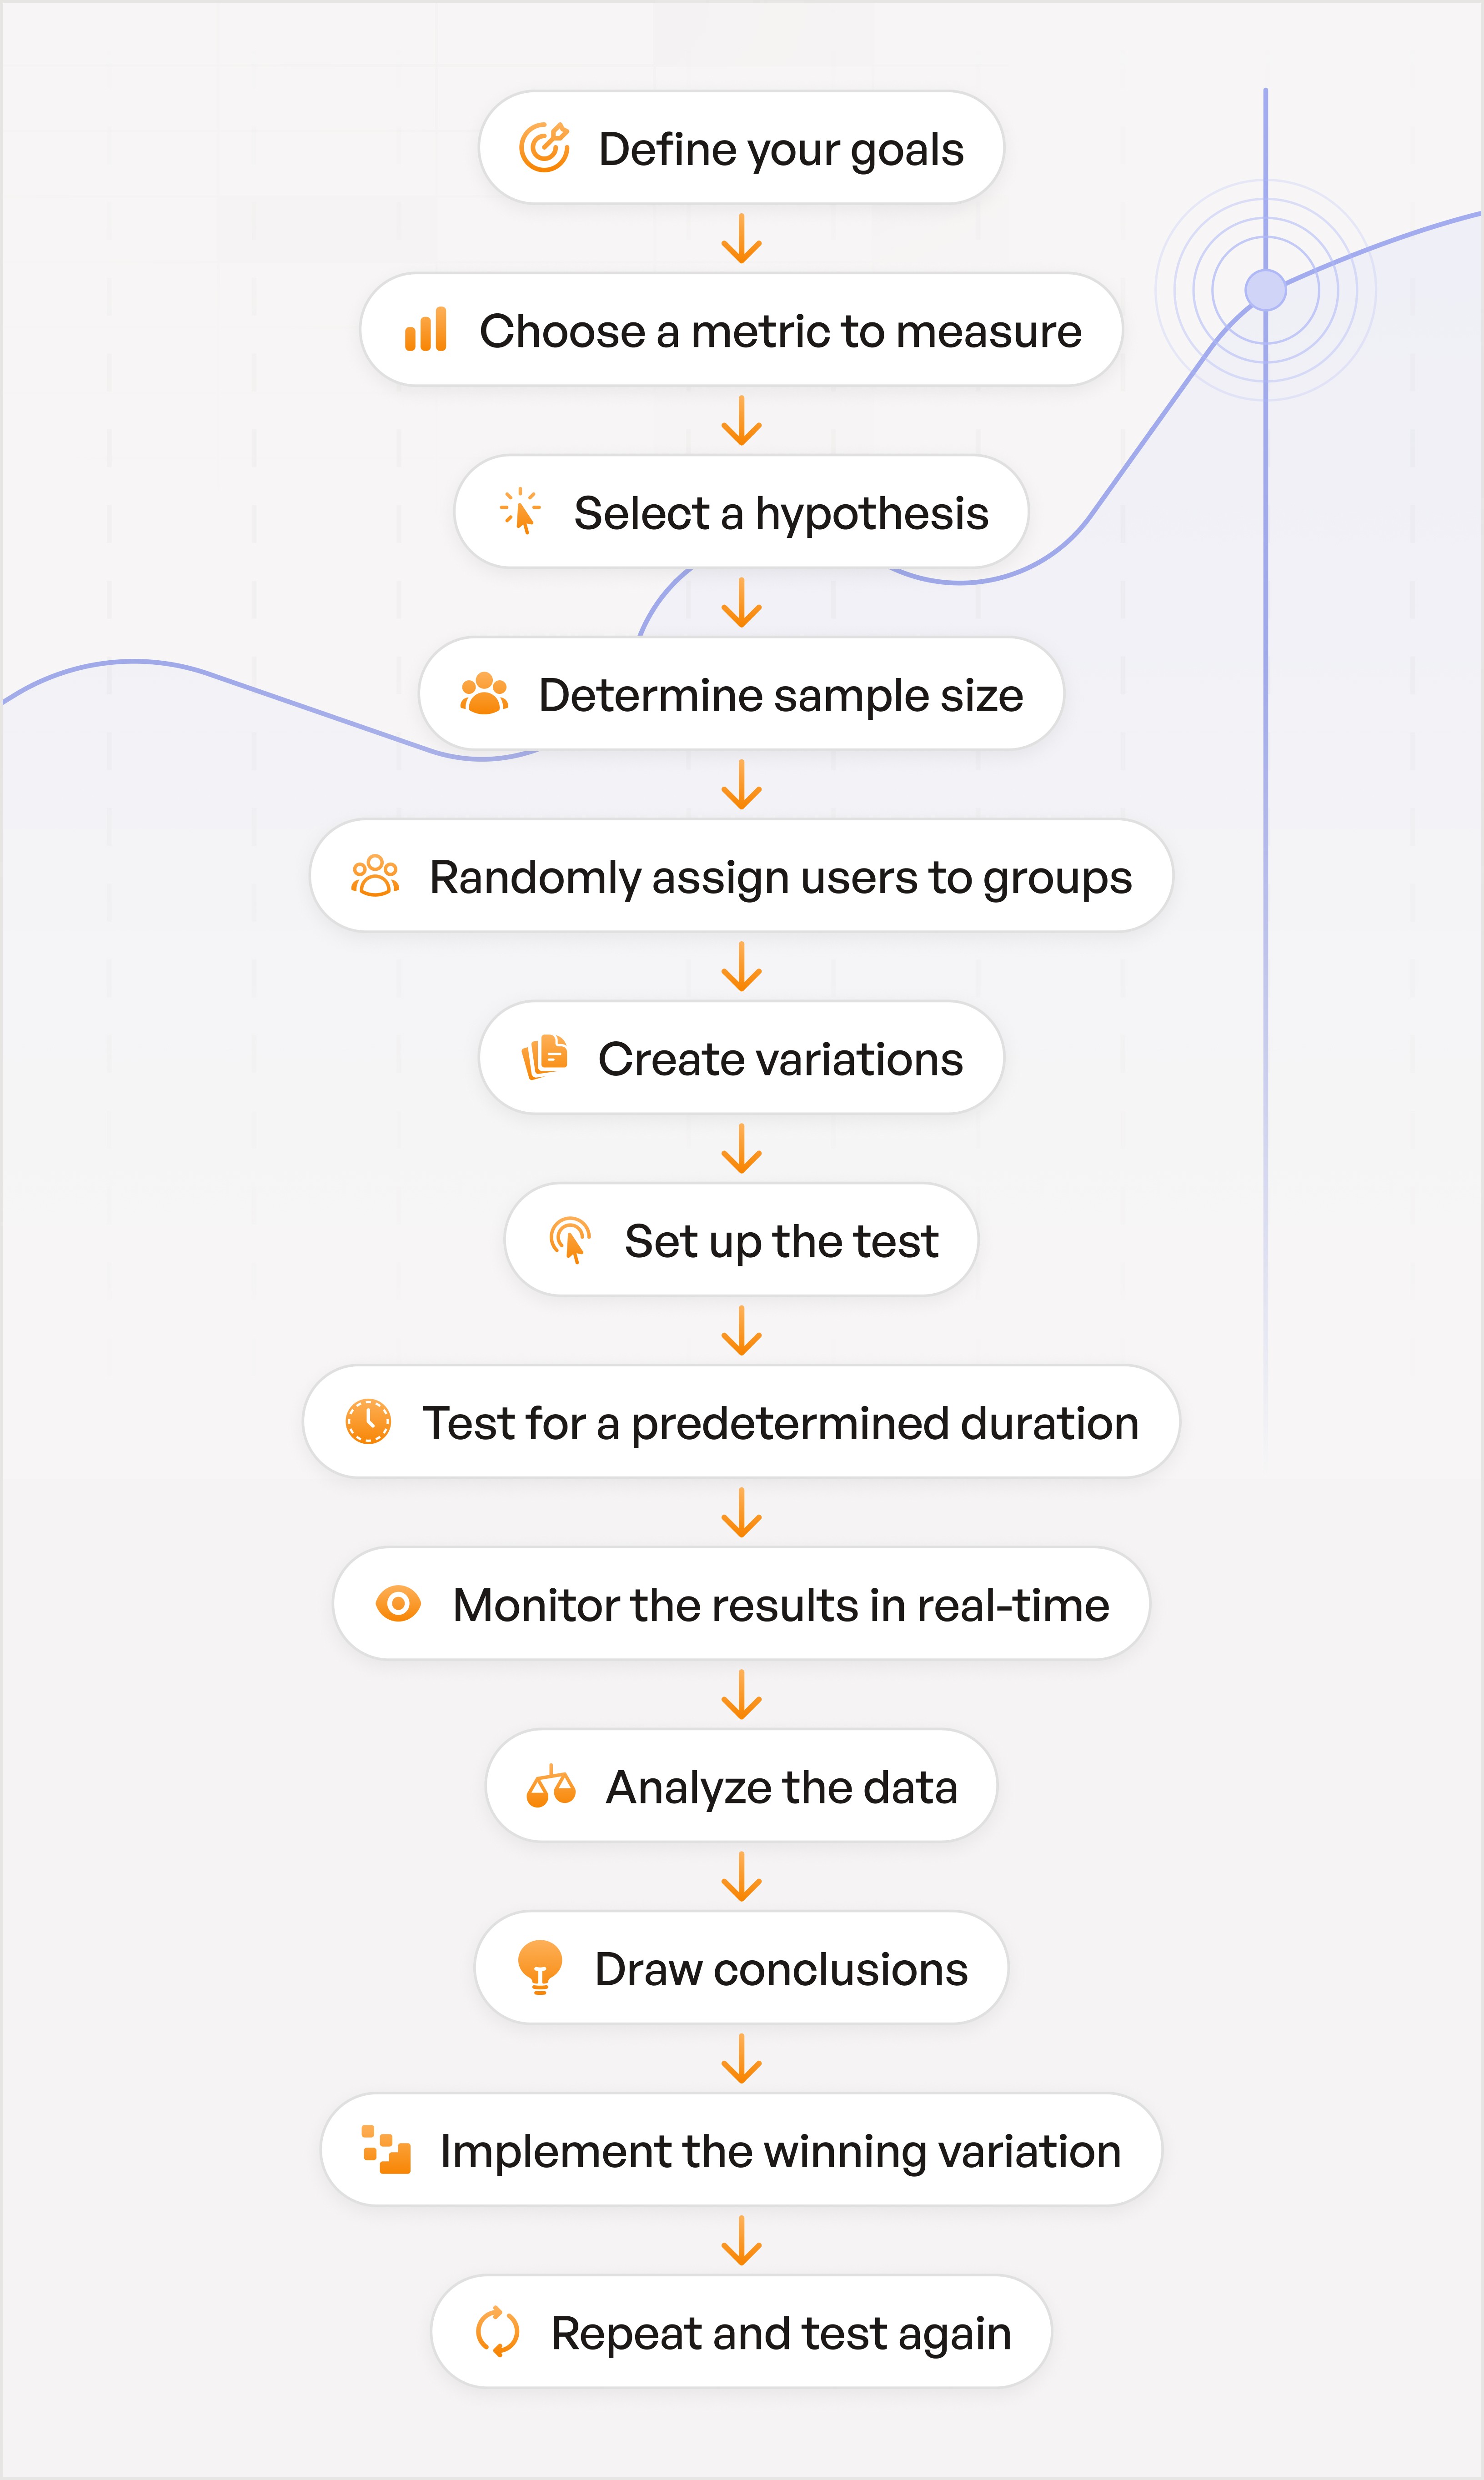
Defining your goals is the crucial first step in conducting A/B testing effectively.
Clearly articulate what you aim to achieve through A/B testing. Maybe you want to increase conversions, improve user engagement, or enhance user experience. Align goals with your broader business objectives.
Set measurable and achievable targets for each goal. For example, improve conversion rates by 10%. Having specific targets helps you evaluate the effectiveness of your A/B test.
Account for the impact of your A/B test on user experience. Any changes should align with your brand identity and enhance the customer journey. Avoid sacrificing user experience for the sake of short-term gains in metrics.
Ensure your A/B testing goals align with your broader business strategy and objectives. For instance, does achieving your goals through A/B testing contribute to long-term growth, profitability, and customer satisfaction?
Document your goals clearly and concisely. Share this information with team members involved in the A/B testing process to ensure alignment and understanding.
Defining your goals helps you lay the foundation for a successful A/B testing strategy. Clarity around your objectives, targets, user experience, and business strategy sets the stage for meaningful experimentation and actionable insights.
Selecting the right metric to measure is vital in A/B testing. Because it determines how you evaluate the success of your experiment.
Familiarize yourself with the metrics often used in A/B testing to gauge performance. These may include:
Conversion rate
Revenue per user
Click-through rate
Average order value
Track metrics relevant to your business objectives.
Choose metrics that directly align with the goals you defined in the first step of the A/B testing process. For instance, increasing conversions is your goal, your primary metric will be conversion rate.
Ensure the metric accurately reflects the desired outcome of your A/B test.
Focusing on a primary metric is essential. That doesn't mean you can't consider secondary metrics for additional context and insights. Secondary ones may include:
Engagement metrics - time on page or number of page views
Behavioral metrics - cart abandonment or form completion
Retention metrics - repeat purchase rate or churn rate
Opt for metrics that are quantifiable and easily measurable. Clear, numerical metrics make it easier to assess the impact of variations and draw meaningful conclusions from the A/B test results.
Ensure your chosen metric is sensitive to changes. For instance, changes to CTAs can dramatically affect conversion rates.
But it also depends on what you change within the CTA. Changing the color is pretty pointless - unless you’ve got a massive sample size to test. You’re unlikely to see statistical significance with a color change.
Track changes in the selected metric over time to assess the long-term impact of A/B testing variations. The analytics you get from calculators, product configurators, quizzes, surveys, forms, and tests with ConvertCalculator can make this easier.
Choosing a metric to track keeps your A/B testing efforts focused, measurable, and aligned with your business objectives.
This lets you evaluate the effectiveness of variations. The results guide decision-making to optimize performance and meet your goals.
Choosing a hypothesis lays the foundation for your experiment and guides the design of your variations.
A hypothesis is a proposed explanation or prediction for the outcome of your A/B test. It states the expected effect of the changes you plan to make, serving as the basis for comparing variations.
A hypothesis is a clear and testable statement about the expected impact of your changes.
Start by identifying the specific changes or variations you want to test. Formulate hypotheses as testable statements that predict how changes will influence metrics. Be specific, measurable, and focused on a single variable to ensure clarity and precision.
Example: Adding a CTA to my landing page will increase conversions by 5%.
Base your hypotheses on existing insights about user behavior, preferences, and pain points. For instance, you might have data showing your web pages with CTAs convert more customers.
Clearly define success criteria for each hypothesis to determine what a successful outcome looks like. Establishing clear success criteria helps you evaluate the results of the A/B test and make data-driven decisions.
A clear hypothesis guides the A/B test, helping you draw meaningful conclusions and actionable insights from the results.
The sample size can impact the reliability and validity of your A/B test results.
Statistical power refers to the likelihood of detecting "true" differences between variations in your A/B test. Was the outcome a fluke or achieved through your changes?
A higher statistical power increases the chances of detecting meaningful differences when they exist. Generally, a larger sample size means higher statistical power.
Consider practical constraints and limitations when determining the sample size for your A/B test. Time, budget, and resources may influence your ability to collect a large sample size.
Factors such as seasonality, user behavior, and external factors may contribute to variability in your metrics. Review the variability or uncertainty in your data when calculating sample size.
For instance, running conversion rate tests during known consumer lull periods could increase variability.
You'd need a larger sample size to achieve the same level of statistical power as standard consumer periods.
A carefully calculated sample size:
Ensures adequate statistical power
Enhances the validity of your findings
Enables you to make data-driven decisions
Randomly assigning users to groups also ensures the validity and fairness of your test.
Random assignment helps eliminate selection bias. The chance of assigning users to either the control group (A) or the variation group (B) is equal.
Randomly allocating users to groups minimizes the risk of skewing the results of your A/B test.
Random assignment preserves the comparability of groups by creating statistically equivalent samples. You can attribute differences observed between the groups to your changes rather than any pre-existing differences.
Random assignment helps ensure each group is representative of your user base. Randomly selecting users from the entire pool of potential participants creates samples that accurately reflect the diversity and variability of your target audience.
This allows you to draw conclusions that apply more broadly.
Say you're A/B testing emails and want to split your list randomly. Your email software might offer A/B testing, or it might not.
You can still do it if not. Download your email list as a CSV and randomly sort it in Excel.
Randomization promotes fairness and integrity in the testing process.
Creating variations is designing the different versions of your content to test against each other.
Identify the specific elements of your content you want to test. These include headlines, call-to-action buttons, images, layouts, and text such as form fields or quiz questions.
Be strategic in designing variations that are meaningful, relevant, and aligned with your testing objectives. Focus on changes with the potential to produce measurable differences.
Test incremental changes to isolate the impact of individual elements and avoid making too many modifications at once. Your best bet is testing one change to an element at a time - like a CTA.
Testing too many changes can skew the results. Which one had the desired impact? That’s hard to answer if you change too many elements.
Test one variation at a time.
This helps you understand the specific factors contributing to improvements or declines in performance. You can make more informed decisions about optimization strategies moving forward.
Experiment with different approaches, styles, or messaging strategies to gauge their effectiveness in achieving your goals. For instance, you could test various survey question types to see which gets the best submission rates.
Strategically creating variations helps you uncover valuable insights into what resonates best with your audience to drive desired outcomes.
Setting up the test involves implementing the variations and configuring the experimental conditions to ensure accurate and reliable results.
Select a suitable A/B testing platform - if you don't use one already. What should you look for?
Robust features
Reliable tracking
User-friendly interfaces
The platform should simplify designing experiments, managing variations, and analyzing results.
These include test duration, sample size, traffic allocation, and experimental conditions. Determine how long the test will run, the percentage of users, and how you'll split traffic between groups.
Implement the variations created in the previous step. Employ variations consistently across all relevant pages, elements, or touchpoints in the test.
Track your relevant metrics throughout the A/B test. Implement tracking codes, tags, or scripts on your tools to capture data accurately and reliably. Verify that tracking is set up correctly and can record activity across variations.
Running the test for a predetermined duration allows sufficient time to collect data, observe user behavior, and analyze results accurately.
Base test duration on traffic volume, conversion rates, and the expected time required to detect meaningful differences between variations. Consider practicalities like budget constraints and campaign timelines.
Seasonal fluctuations or trends may impact user behavior or performance metrics during the test period. Adjust the test duration to accommodate seasonal variations. This gives you a more representative test sample.
Consider running the test longer or segmenting data by season to account for seasonality effects.
Consistent test conditions and data collection procedures throughout the test help you get reliable results. Avoid making significant changes to one group mid-test. This can introduce bias, confound results, or invalidate comparisons between groups.
Resist the temptation to draw early conclusions or make decisions based on early results. Allow data to accumulate and stabilize before analyzing results and drawing conclusions.
Rushing to conclusions before the test has run its course can lead to inaccurate or misleading interpretations of results.
Setting a predetermined duration lets you collect sufficient data to draw reliable conclusions from your A/B testing. Then, you can make informed decisions for your next steps.
Monitoring the results allows you to track the performance of variations, identify trends, and make data-driven decisions.
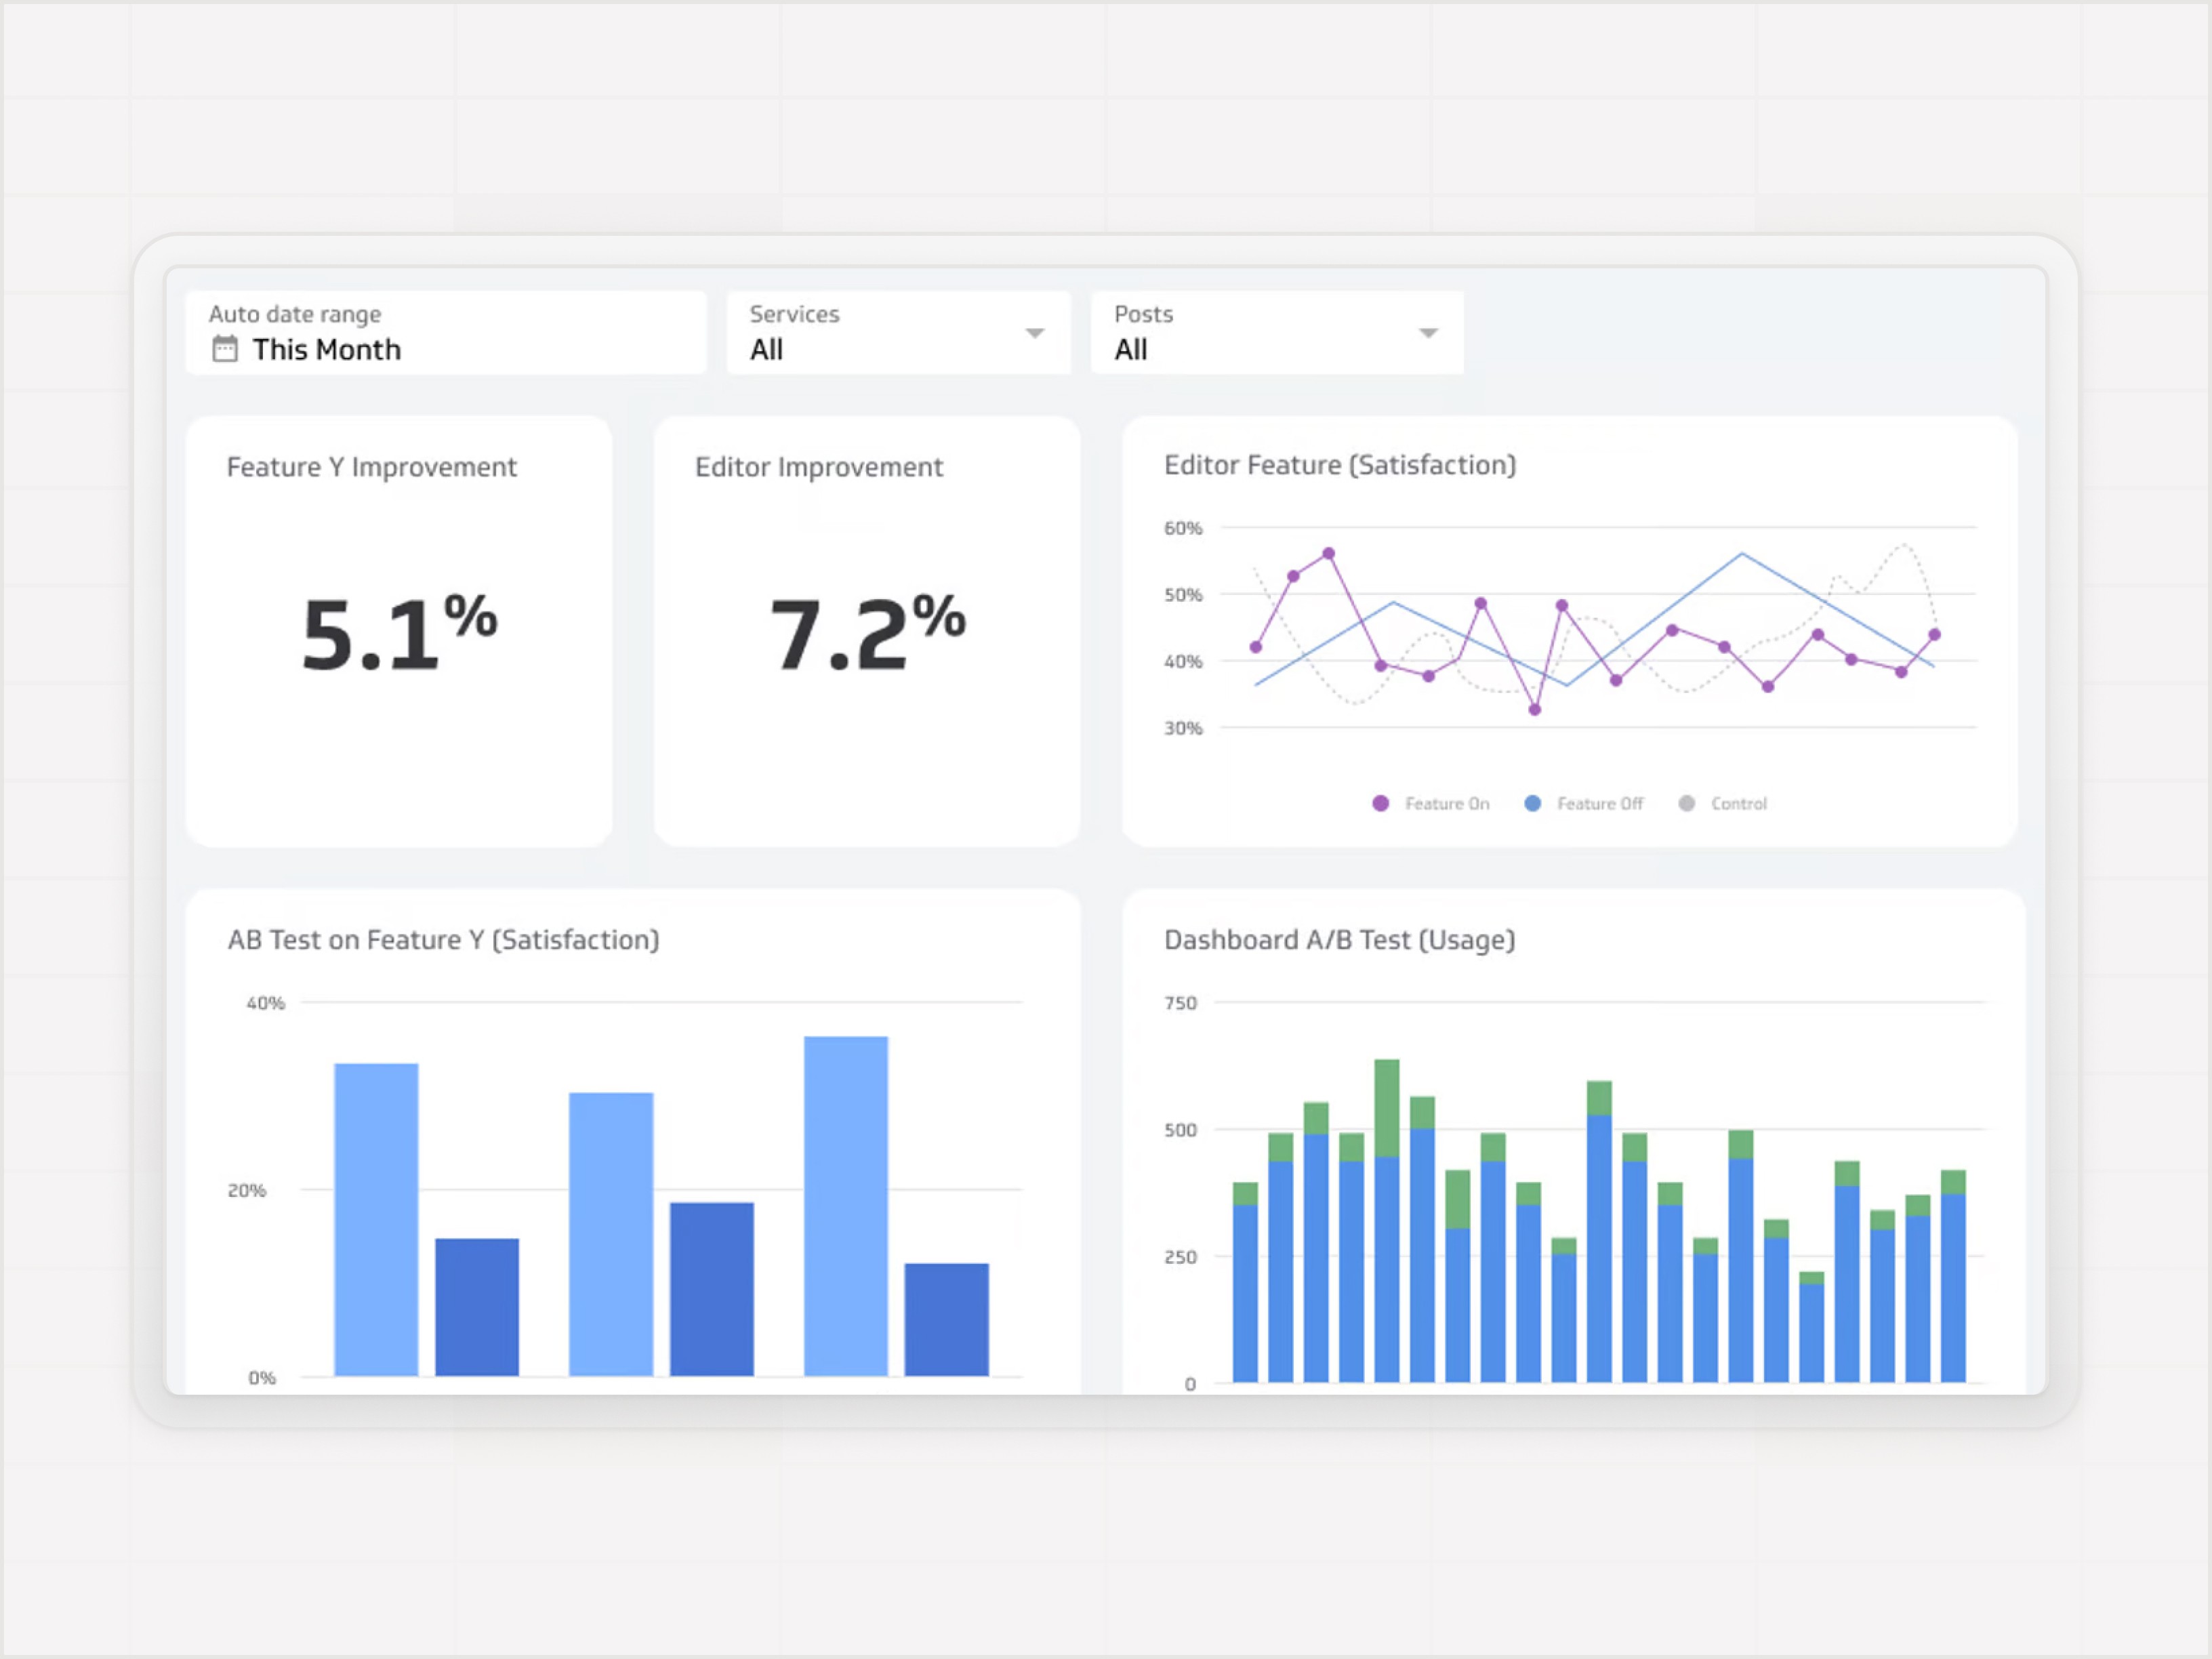
Use the testing platform's reporting tools to monitor performance, interim results, and unexpected trends. Watching for changes throughout the test helps you prepare for analysis.
Make sure to track your key metrics. Monitor metrics like conversion rate, click-through rate, bounce rate, average session duration, revenue per user, or any others you see fit.
Set up alerts and notifications to get updates when significant changes occur in the test results. You could configure thresholds or triggers based on predefined criteria - sudden fluctuations in metrics, deviations from expected trends, or attainment of predefined milestones. Alerts help you stay informed of real-time changes.
Monitor user feedback, comments, or reactions to variations. This offers further insights into user perceptions, preferences, and experiences.
Collecting feedback through social media interactions can supplement quantitative data with qualitative insights. User feedback gives you more data to analyze in the next step.
Analyzing the data involves examining the results of the test. You want to draw meaningful insights, make informed decisions, and derive actionable recommendations.
Focus on your goal metric - calculator submission rate, for instance. You'll track other metrics, but one will be the most significant.
Would you care about time spent on the calculator if submissions were low? Probably not. You'd choose the version with less time spent and higher submissions every day.
Analyzing your goal metric shows you which variation performed best.
Conduct a quantitative analysis to assess the statistical significance of your changes. This tells you if the changes are significant enough to run with that variation.
Use the A/B testing calculator at the end of this post to assess statistical significance.
Trust in Results: While your findings are statistically significant at the 90% and 95% confidence levels, they are not at the 99% level. This means you can be reasonably confident that the observed differences are real, but there is still a small chance they are due to random variation.
Decision Making: Depending on your risk tolerance and the context of your test, you might choose to act on the findings if 90% or 95% confidence is sufficient for your decision-making process. However, if your decisions require a very high level of certainty, you might want to conduct further testing to achieve significance at the 99% level.
If you require very high confidence in your results, you might need to increase your sample size or refine your test. However, for many practical purposes, achieving significance at the 95% level is often considered sufficient to make informed decisions.
St. Error (Standard Error) Definition:
The standard error measures the accuracy with which a sample distribution represents a population by considering the variation or "spread" of the sample data points. In A/B testing, it is used to quantify the uncertainty in the conversion rates or other metrics being measured.
Con. Rate (Conversion Rate) Definition:
The conversion rate is a key metric used in A/B testing and digital marketing to measure the percentage of visitors to a website or users of a service who complete a desired action. This action could be anything from making a purchase, signing up for a newsletter, filling out a form, or any other goal defined by the business.
Supplement quantitative analysis with qualitative insights. You can use feedback, comments, or other observations collected during the A/B test. Incorporating qualitative insights gives you a deeper understanding of user behavior to inform optimization strategies.
Data analysis helps you identify optimization opportunities, validate hypotheses, and drive continuous improvement.
Interpreting findings and drawing conclusions helps with informed decision-making and optimization strategies.
Assess the effectiveness of variations in achieving the testing goals. Evaluate the impact of changes from your quantitative analysis and organize the findings. Determine whether variations produced statistically significant improvements, declines, or no discernible effects.
Validate the hypotheses you formulated at the beginning of the A/B test based on the results. Assess whether the experimental changes resulted in the expected effects on chosen metrics.
Were your hypotheses supported, refuted, or inconclusive?
Pinpoint areas for improvement based on insights gleaned from the A/B test results. Record the changes that significantly contributed to variations in metrics and prioritize optimization efforts for the highest impact on business outcomes.
Recording findings, insights, and recommendations encourages knowledge-sharing, collaboration, and decision-making within your organization. Create documentation summarizing the test methodology, results, conclusions, and actionable takeaways.
Implementing the winning variation is sending the new version into the wild. After you apply the insights and conclusions, it should perform better than the previous one.
Tie everything together from your analysis and conclusions to select the winning variation. This version produced statistically significant improvements regarding your chosen metric, the LeBron of your variations.
What are the practical implications of the A/B test results for your marketing strategy and business overall? Assess the feasibility, scalability, and resource implications of actioning changes. Consider organizational and technical constraints when determining your next steps and action plans.
Publish the winning variations to make them live for your audience. Make changes to your product configurators, calculators, surveys, forms, or quizzes.
Implementing the winning variation helps you stay competitive in a dynamic digital environment.
Continuously refine and optimize variations based on insights from previous tests and ongoing performance monitoring.
Investigate the post-implementation performance of the winning variation. Assess its continued impact on your key metrics.
Identify optimization opportunities and areas for improvement. Think changing an element will get better results? Pinpoint elements you can refine or optimize to drive better results - potentially.
Time to put the optimization opportunities you identified to the test. Run the changes through these 13 steps and see if they produce better results.
These 13 steps will help you optimize your ConvertCalculator content through A/B testing. Discover what your audience likes and doesn’t like about your:
Will you publish content and hope for the best? Or make informed decisions for your marketing campaigns?

Emma Francey
Copywriter @ConvertSite